DBSCAN is a density-based Clustering algorithm that groups closely-packed points and labels low-density regions as noise.
Parameters
Inputs:
,
is the radius defining a point’s neighbors
is the minimum numbers of points
Algorithm
- pick random point
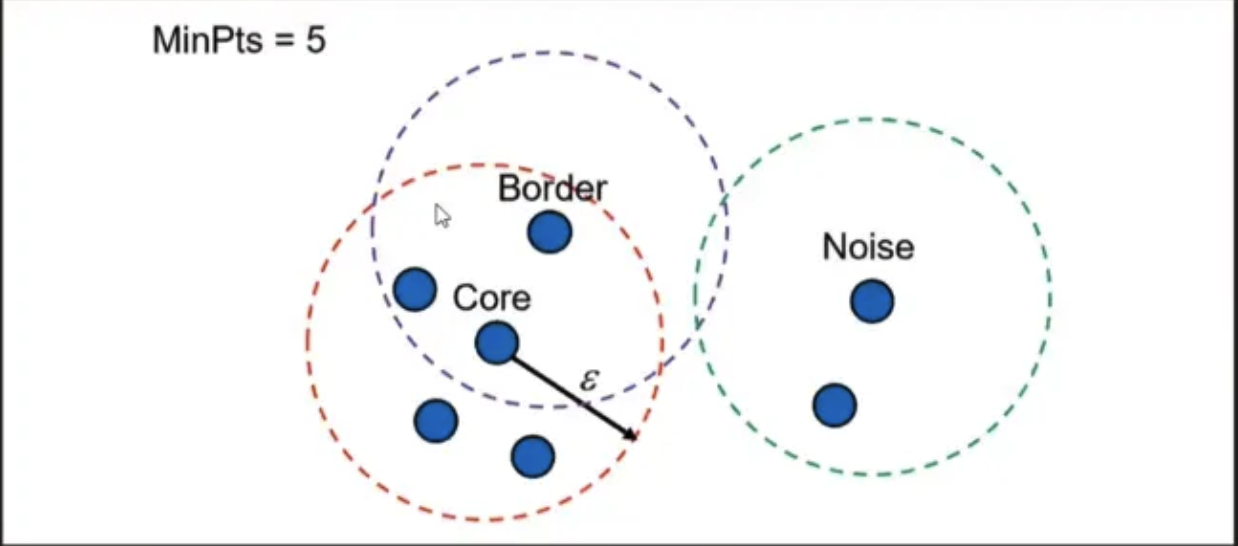
- if has less than neighbors (including itself) within radius , label it as noise
- Until is a new core point
core points: Points with within radius
border points: not a core point, but within distance of one or more core points
Explain to Others
Assume you have a dataset X, run DBSCAN, and get a clustering that contains a set of clusters and some noise points (there’s no need to be more precise; it’s only important that you don’t get just noise). Let’s also assume you create a new dataset X_new simply by shuffling X (i.e., randomly change the order of data points in the dataset); no other changes. Now you run DBSCAN with the same parameters as before over X_new and get a different clustering, i.e., most of the clusters are not exactly the same as before.
**What does this information tell about the dataset and clustering? ** This may include a brief discussion how changing the parameters of DBSCAN will likely affect the results.
- Theoretically, we pick the starting points arbitrarily, so shuffling the dataset should not affect the final clustering result. However, the implementation of DBSCAN in
sklearnmay be affected by the order of the data points as it always starts from the first unvisited points, and then go to the next rows of data which is the next unvisited points. Therefore, if we shuffle the dataset, the order of the data points will change, which may lead to borderline points being classified differently, resulting in different clusters. - Above experiment also tells that the dataset has borderline situation where many points lie close to the , sometimes they are core points and sometimes are border points. The order of the data points in the implementation of DBSCAN matters as it starts from the first row. If the clustering is not well-seperated, the borderline points may be classified differently, leading to different clusters.
- This tells us the clustering results from DBSCAN is unstable and sensitive to parameter choices.
- Increasing or lowering MinPts will make clusters denser, absorb more border points, and reduce noise.
- Decreasing or increasing MinPts will fragment clusters further and produce more noise.
K-distance Graph
See DBSCAN - K-distance Graph.
References
A Guide to the DBSCAN Clustering Algorithm | DataCamp good guide to implementation
Visualizing DBSCAN Clustering