Statistical Methods
Five Number Summary
Get 5 number summary with columns.describe()
Use visualization methods:
- Histogram
- Scatterplot
- Boxplot
- Inter Quartile Range (IQR)
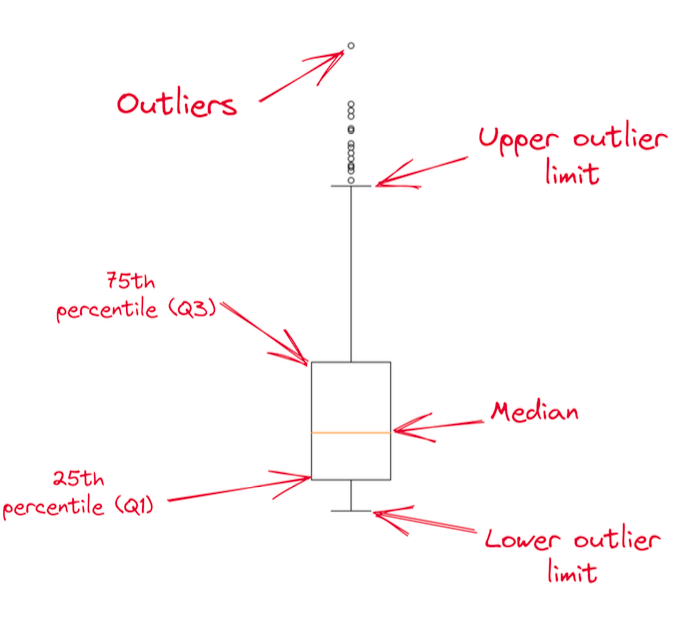
IQR Calculation:
- IQR = Q3 - Q1
- Whisker lengths is a combination of IQR and a factor
- Factor = 1.5
- Lower limit: Q1 - 1.5 × IQR
- Upper limit: Q3 + 1.5 × IQR
Z-score
Z-score tells the number of standard deviations from the mean.
Formula:
Where:
- Z is the z-score
- x: observed value
- μ: mean
- σ: standard deviation
Implementation:
# Import the zscores function
from scipy.stats import zscore

# Find the zscores of prices
scores = zscore(prices)

# Check if the absolute values of scores are over 3
is_over_3 = np.abs(scores) > 3

# Use the mask to subset prices
outliers = prices[is_over_3]

print(len(outliers))
Rule of Thumb: If a sample is more than 3 standard deviations away from the mean, consider it as an extreme value.
Drawbacks:
- Assumes data comes from normal distribution; otherwise, results will be misleading
- Mean and STD are heavily influenced by outliers
- Suffers from too many outliers
Median Absolute Deviation (MAD)
Formula:
Where:
- MAD: median absolute deviation
- X_i: each value
- X̃: median
Advantages:
- More resilient to outliers
- Measures dispersion (离散性)
Modified Z-score with MAD in PyOD
PyOD: Python Outliers Detection library
- 40+ algorithms
- All algorithms have scikit-learn syntax